Aurore Receveur, Christophe Menkes, Matthieu Lengaigne, Alejandro Ariza, Arnaud Bertrand, Cyril Dutheil, Sophie Cravatte, Valérie Allain, Laure Barbin, Anne Lebourges-Dhaussy, Patrick Lehodey & Simon Nicol
Published in Nature Communications, June 2024
Oceanic eddies are recognized as pivotal components in marine ecosystems, believed to concentrate a wide range of marine life spanning from phytoplankton to top predators. Previous studies have posited that marine predators are drawn to these eddies due to an aggregation of their forage fauna. In this study, we examine the response of forage fauna, detected by shipboard acoustics, across a broad sample of a thousand eddies across the world’s oceans. While our findings show an impact of eddies on surface temperatures and phytoplankton in most cases, they reveal that only a minority (13%) exhibit significant effects on forage fauna, with only 6% demonstrating an oasis effect. We also show that an oasis effect can occur both in anticyclonic and cyclonic eddies, and that the few high-impact eddies are marked by high eddy amplitude and strong water-mass-trapping. Our study underscores the nuanced and complex nature of the aggregating role of oceanic eddies, highlighting the need for further research to elucidate how these structures attract marine predators.
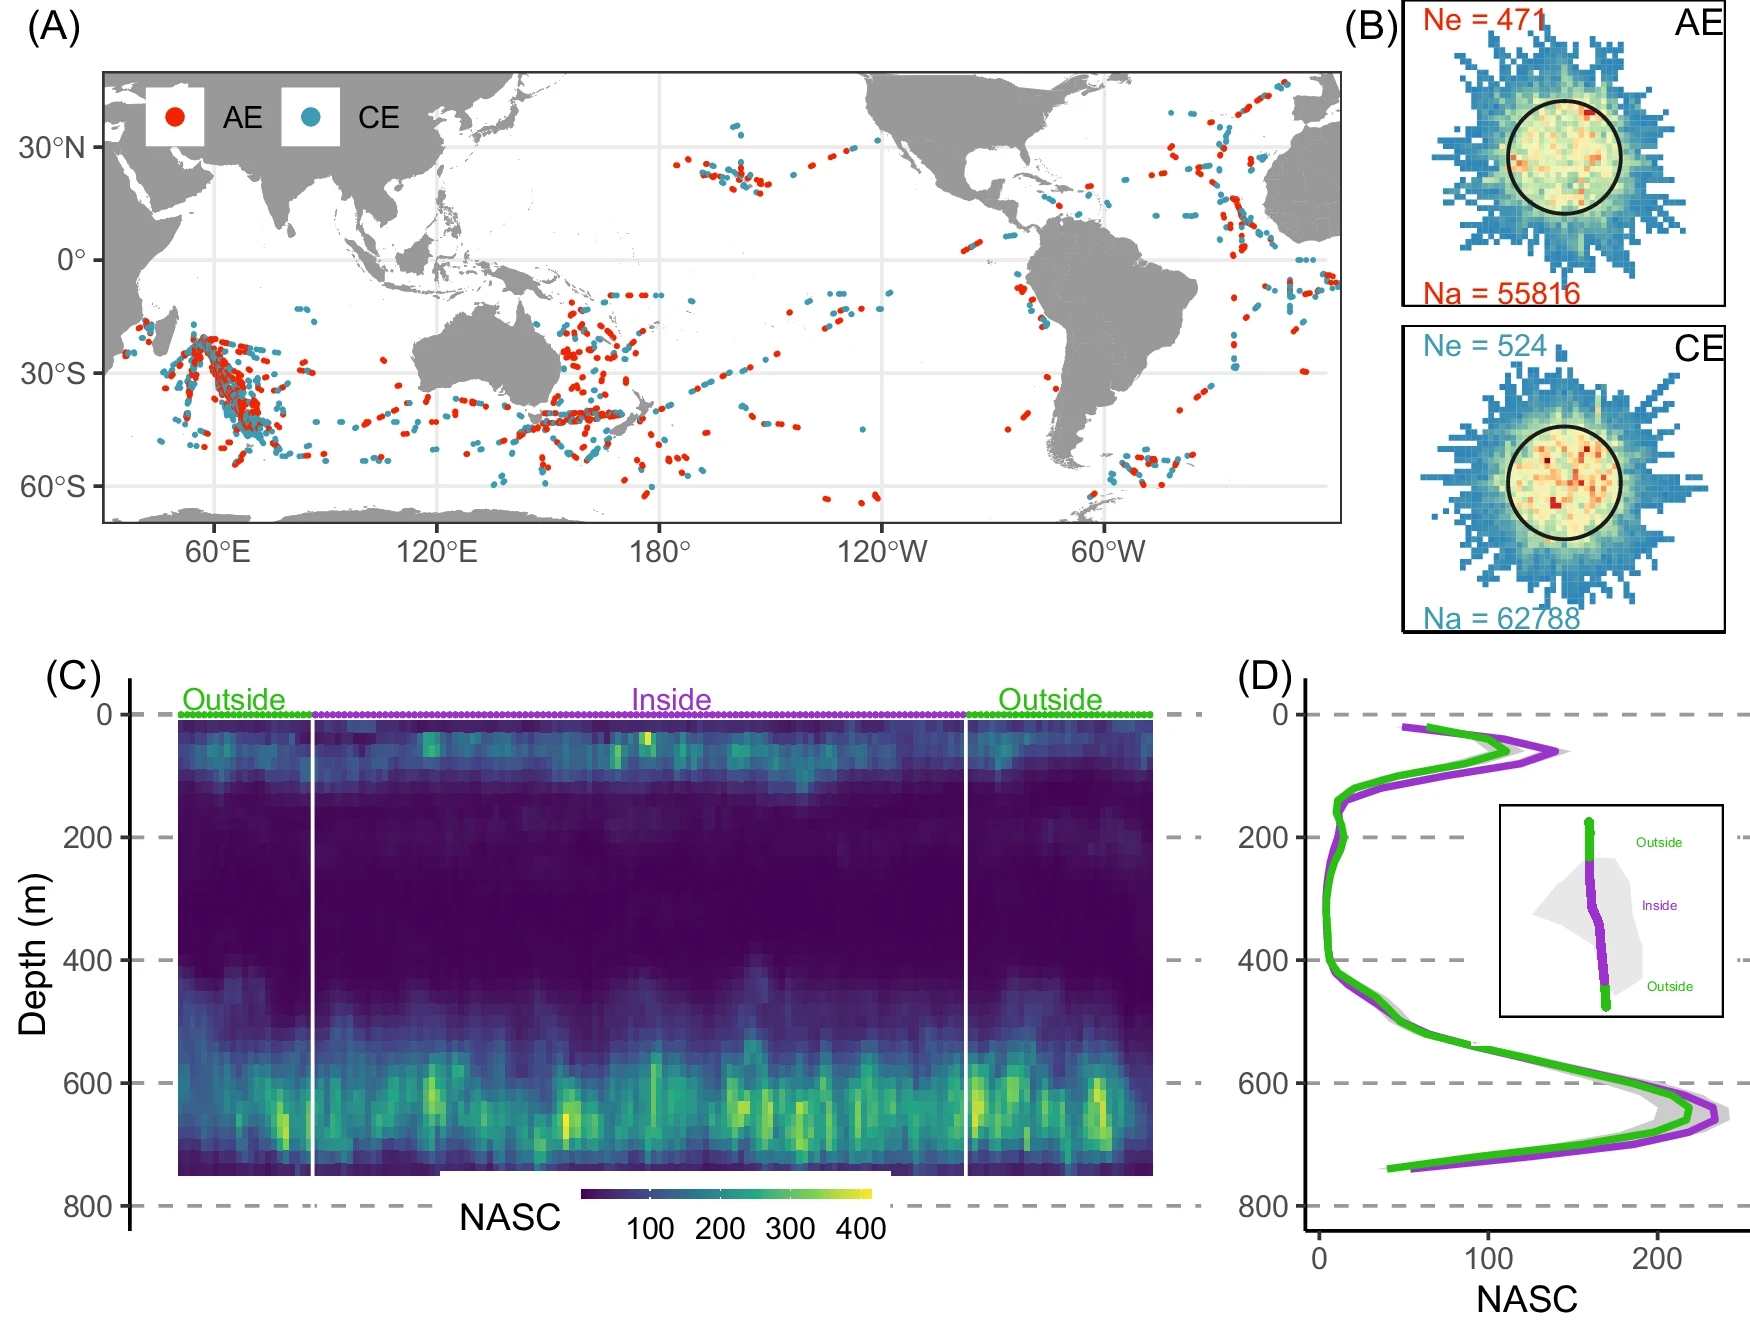
Fig. A map of acoustic data sampling cyclonic (CE, blue) and anti-cyclonic (AE, red) eddies; (B) density of acoustic tracks around and within eddies (from blue to red, dark cycles represent the normalized effective radius) for anti-cyclonic (AE, top panel) and cyclonic (CE, bottom panel) eddies; numbers indicate the number of sampled eddies (“Ne =”, top) and the number of acoustic profiles (“Na =”, bottom) in each eddy type; (C) Example of one acoustic track section in an anticyclonic eddy showing scattering sound layers of marine fauna (unit: Nautical Area Scattering Coefficient, NASC in m2 mn−2). The vertical white bars denote the separation between the “inside” and “outside” of the sampled eddy, as depicted in (D) by the grey polygon and the acoustic track from the ship. In (D), the vertical mean NASC profiles in the inside (purple) and in the outside (green) areas are drawn together with the 95 % confidence interval (1.96*standard deviation/root square of number of observations) of the mean values. Source data are provided as a Source Data file.
Receveur, A., Menkes, C., Lengaigne, M. et al. A rare oasis effect for forage fauna in oceanic eddies at the global scale. Nat Commun 15, 4834 (2024). https://doi.org/10.1038/s41467-024-49113-3