Wei-Lei Wang, Weiwei Fu, Frédéric A. C. Le Moigne, Robert T. Letscher, Yi Liu, Jin-Ming Tang & François W. Primeau
Published in Nature, February 2024
The transfer of photosynthetically produced organic carbon from surface to mesopelagic waters draws carbon dioxide from the atmosphere1. However, current observation-based estimates disagree on the strength of this biological carbon pump (BCP)2. Earth system models (ESMs) also exhibit a large spread of BCP estimates, indicating limited representations of the known carbon export pathways3. Here we use several decades of hydrographic observations to produce a top-down estimate of the strength of the BCP with an inverse biogeochemical model that implicitly accounts for all known export pathways. Our estimate of total organic carbon (TOC) export at 73.4 m (model euphotic zone depth) is 15.00 ± 1.12 Pg C year−1, with only two-thirds reaching 100 m depth owing to rapid remineralization of organic matter in the upper water column. Partitioned by sequestration time below the euphotic zone, τ, the globally integrated organic carbon production rate with τ > 3 months is 11.09 ± 1.02 Pg C year−1, dropping to 8.25 ± 0.30 Pg C year−1 for τ > 1 year, with 81% contributed by the non-advective-diffusive vertical flux owing to sinking particles and vertically migrating zooplankton. Nevertheless, export of organic carbon by mixing and other fluid transport of dissolved matter and suspended particles remains regionally important for meeting the respiratory carbon demand. Furthermore, the temperature dependence of the sequestration efficiency inferred from our inversion suggests that future global warming may intensify the recycling of organic matter in the upper ocean, potentially weakening the BCP.
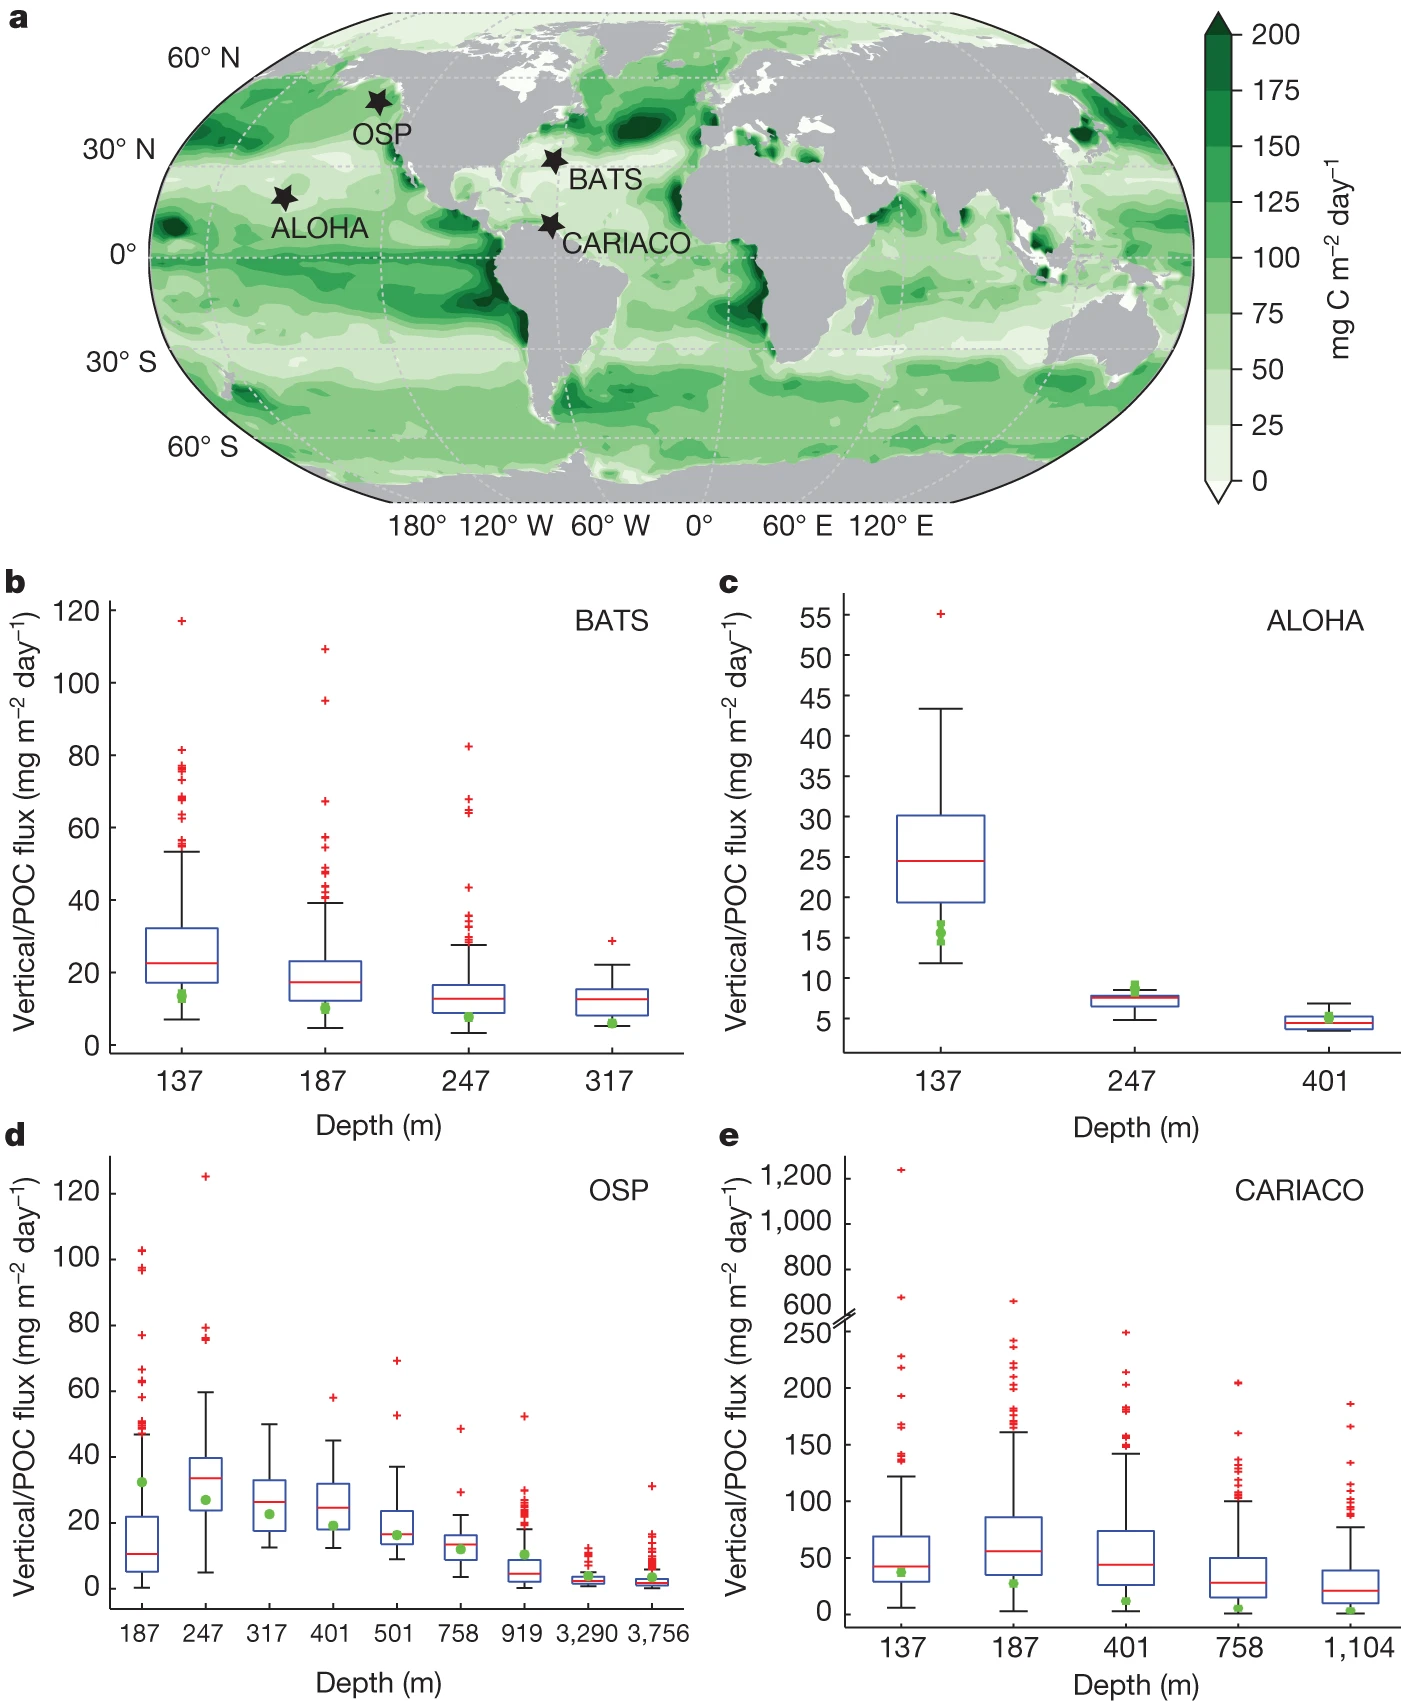
Fig a, Contour plot of non-advective-diffusive vertical flux (mg C m−2 day−1) exiting the base of the euphotic zone, with the location of the four ocean stations (OSP, ALOHA, BATS and CARIACO) marked with black stars. b–e, Model-derived non-advective-diffusive vertical flux at different depths compared with trap-determined POC flux. The box plots represent sediment trap and the green circles are model predictions, with error bars representing ±1σ derived from different model configurations. The box plots summarize the distributions of in situ measurements of POC flux, which show the 25th, 50th and 75th percentiles binned according to the POC flux. The whiskers cover 99.3% of the data, with the remaining points shown as red crosses. In b–e, the sediment-trap data presented are multiyear collections covering a sampling period of 1988–2011 for the BATS station, 1988–2010 for the ALOHA station, 1987–2006 for the OSP and 1995–2012 for the CARIACO station. Because sediment traps are deployed in the water for several months, their measurements represent an average for a relatively extended period instead of a snapshot. The results of a are based on the CbPM NPP product and an e-folding remineralization time of 12 h for labile DOC.
Wang, WL., Fu, W., Le Moigne, F.A.C. et al. Biological carbon pump estimate based on multidecadal hydrographic data. Nature 624, 579–585 (2023). https://doi.org/10.1038/s41586-023-06772-4