Currents off the Papua New Guinea Coast During and After the El Niño of 2015–2016
Jie Wu, Linlin Zhang, Fan Wang, Chalapan Kaluwin, Dunxin Hu
Published in Journal of Geophysical Research, December 2022
Interannual variation of New Guinea Coastal Undercurrent (NGCUC) along the Papua New Guinea (PNG) coast was investigated using mooring observations during 2015–2019 combined with eddy-resolving simulations of the Ocean General Circulation Model for the Earth Simulator (OFES) during 1980–2019. Strong interannual variation appears in the upper 800 m of the currents recorded by the mooring, which is well reproduced by OFES outputs. On the interannual time scale, a relatively larger proportion (1.1 Sv) of the transport signals related to El Niño/Southern Oscillation (ENSO) in the Solomon Sea is transmitted through the Solomon Strait, while about 0.84 Sv of ENSO signal is through the Vitiaz Strait due to the topography constraint. As the NGCUC flows along the PNG coast, the mean transport above 400 m gradually increases while its relationship with ENSO rapidly weakens. This weakening is due to its merging with the westward South Equatorial Current (SEC). The westward SEC weakens (strengthens) during El Niño (La Niña) events, which weakens the interannual signal of NGCUC. The interannual variations of the currents above and below the thermocline off the PNG coast are opposite: a clockwise anomalous circulation straddling the equator appears above the thermocline, while a counterclockwise anomalous circulation appears below the thermocline during El Niño, which is connected to the recharge-discharge oscillation during ENSO cycle.
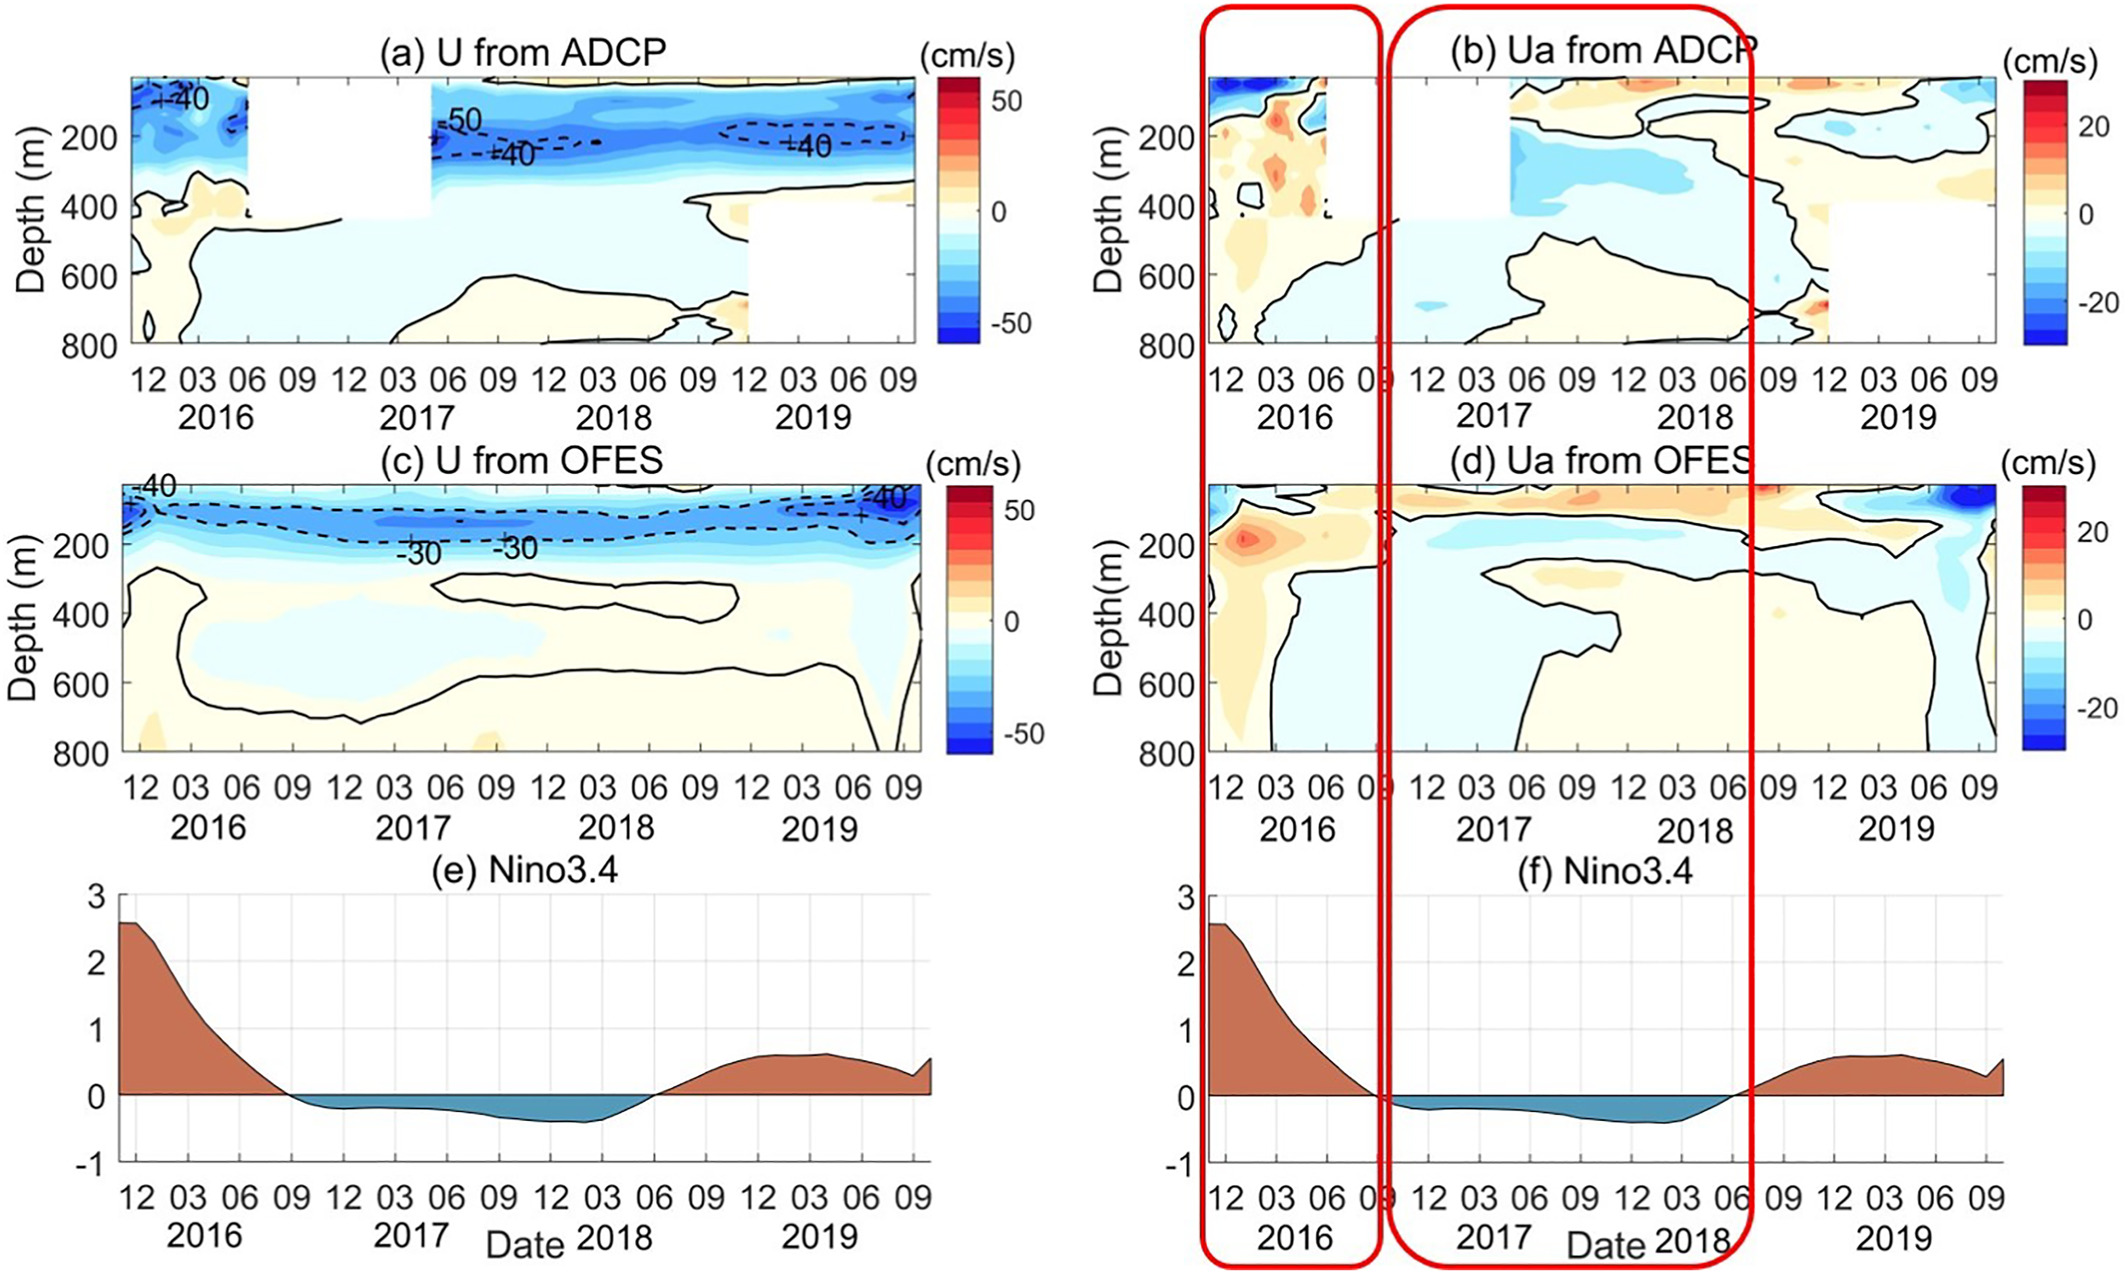
Fig. Time-depth plots of 13-month low-pass filtered monthly along-shore velocity derived from ADCP measurements (a) and OFES outputs (c) at 1.7°S, 141.4°E from November 2015 through October 2019. (b) and (d) are similar to (a) and (c), but for along-shore velocity anomalies, which are obtained by removing the 4-year mean along-shore velocity from (a) and (c). (e) and (f) are time series of 13-month low-pass filtered Niño 3.4 index (colored bars). Black contours indicate the zero-line of velocity, and the dotted contours (negative velocity) indicate the northwestward velocity.
Wu, J., Zhang, L., Wang, F., Kaluwin, C., & Hu, D. (2022). Currents off the Papua New Guinea coast during and after the El Niño of 2015–2016. Journal of Geophysical Research: Oceans, 127, e2022JC018760. https://doi.org/10.1029/2022JC018760