Emergence of changing Central-Pacific and Eastern-Pacific El Niño-Southern Oscillation in a warming climate
Tao Geng, Wenju Cai, Lixin Wu, Agus Santoso, Guojian Wang, Zhao Jing, Bolan Gan, Yun Yang, Shujun Li, Shengpeng Wang, Zhaohui Chen & Michael J. McPhaden
Published in Nature Communications, November 2022
El Niño-Southern Oscillation (ENSO) features strong warm events in the eastern equatorial Pacific (EP), or mild warm and strong cold events in the central Pacific (CP), with distinct impacts on global climates. Under transient greenhouse warming, models project increased sea surface temperature (SST) variability of both ENSO regimes, but the timing of emergence out of internal variability remains unknown for either regime. Here we find increased EP-ENSO SST variability emerging by around 2030 ± 6, more than a decade earlier than that of CP-ENSO, and approximately four decades earlier than that previously suggested without separating the two regimes. The earlier EP-ENSO emergence results from a stronger increase in EP-ENSO rainfall response, which boosts the signal of increased SST variability, and is enhanced by ENSO non-linear atmospheric feedback. Thus, increased ENSO SST variability under greenhouse warming is likely to emerge first in the eastern than central Pacific, and decades earlier than previously anticipated.
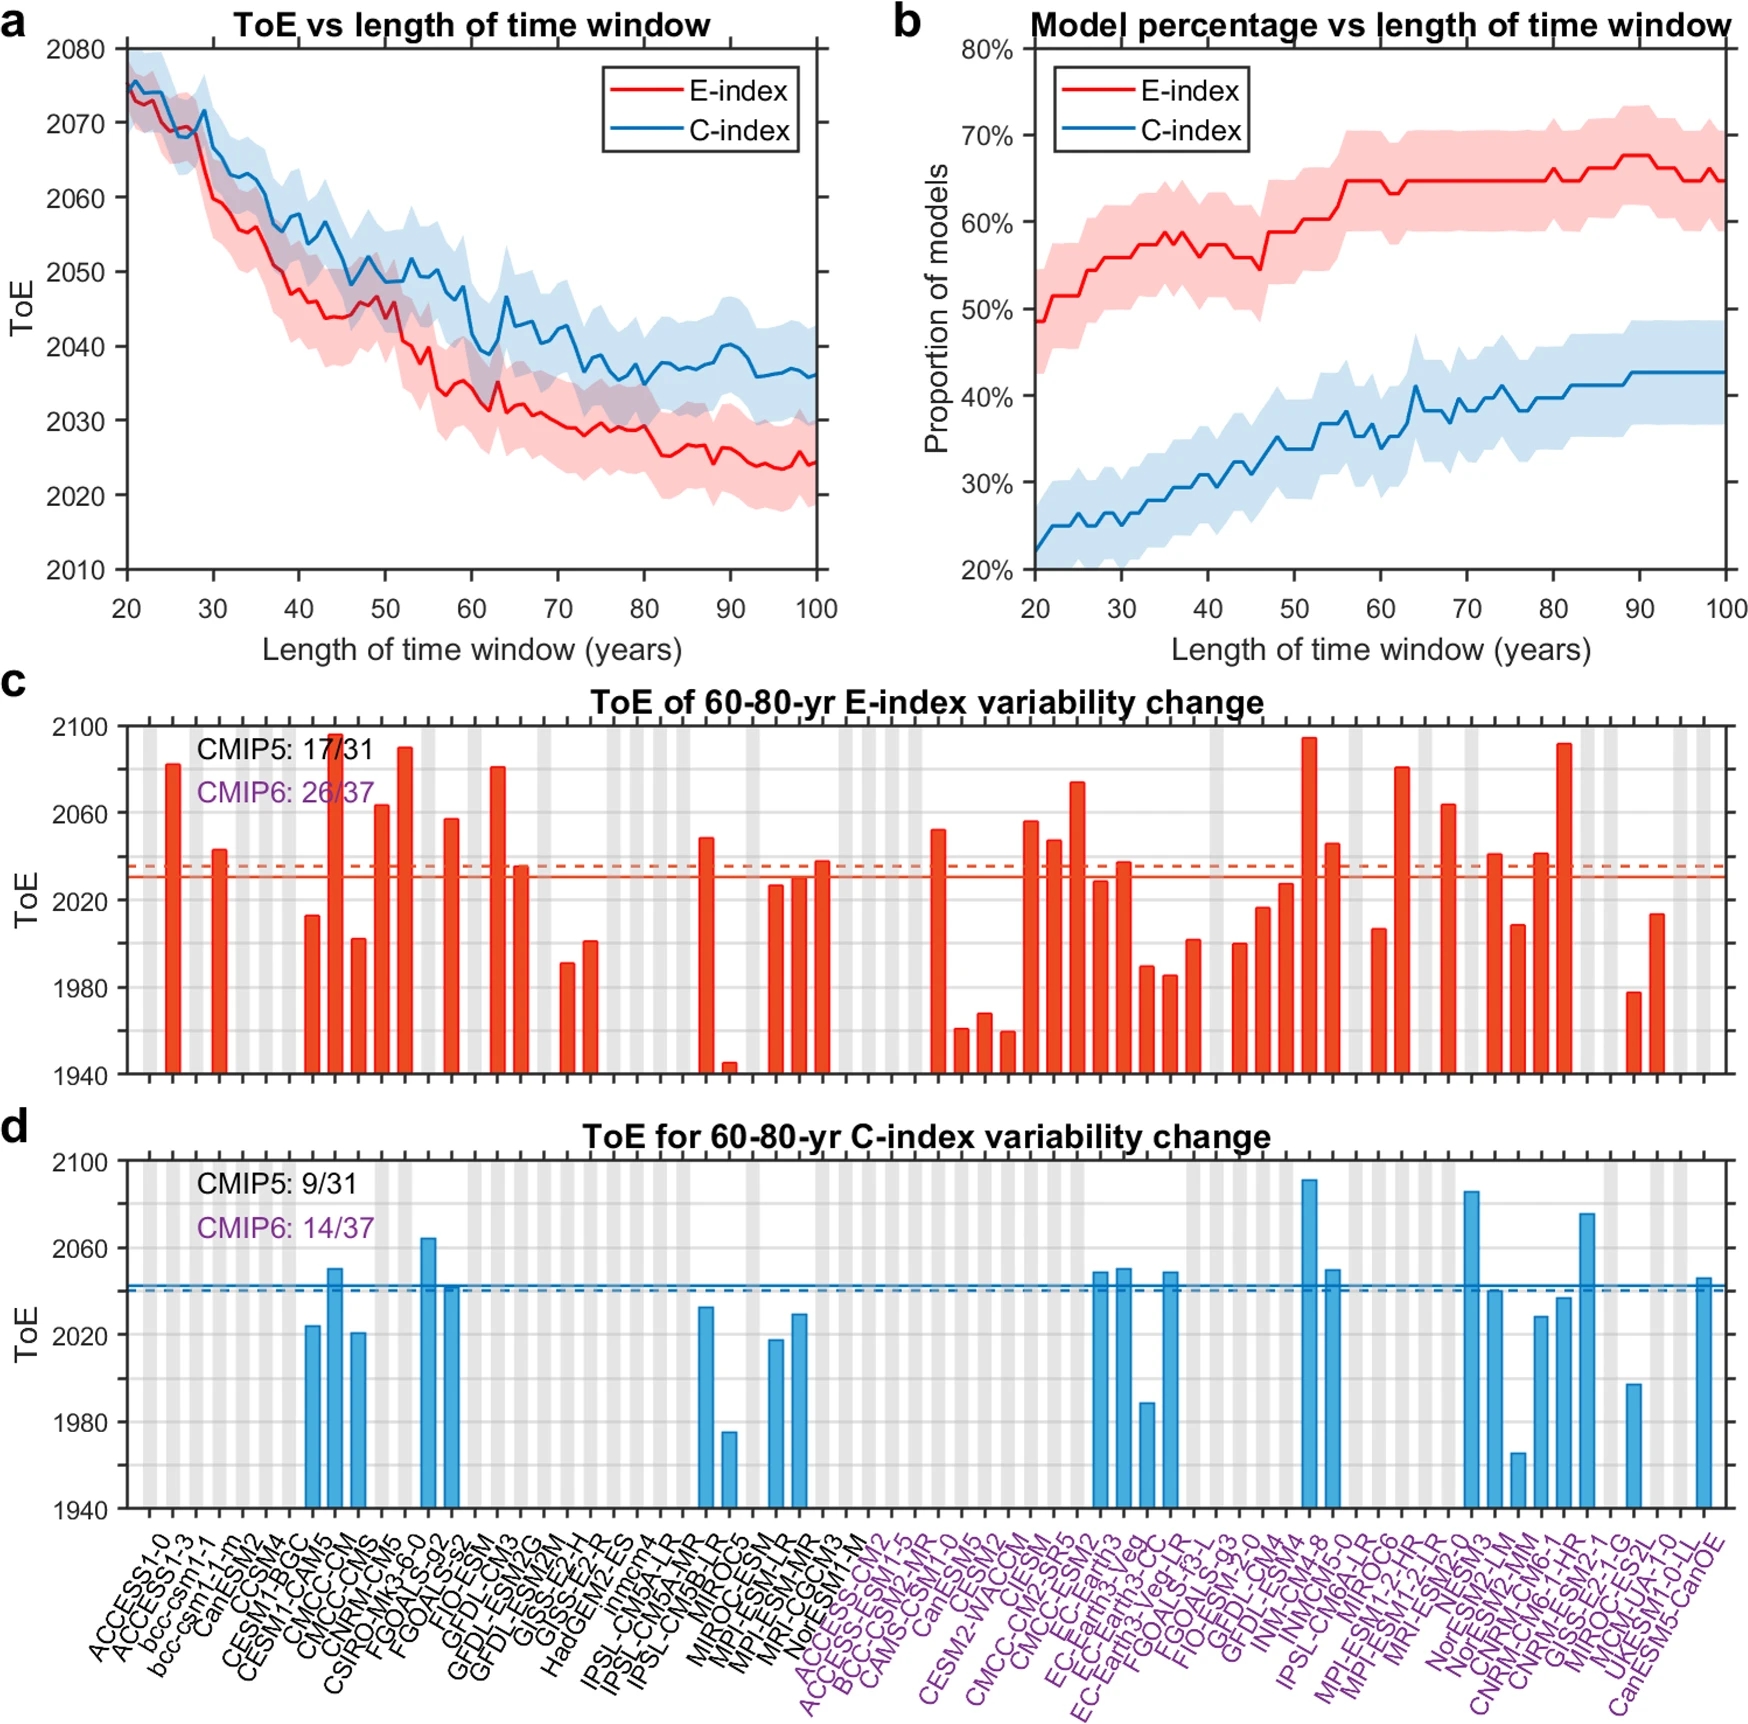
Fig. a Dependence of ToE upon length of time window over which signal and noise are diagnosed for E-index (red) and C-index (blue). b As in a, but for proportion (in percentage) of models that show emergence of E-index (red) and C-index (blue) before 2100. Solid lines and shadings indicate multi-model mean and one standard deviation of a total of 10,000 inter-realisations, respectively, based on a Bootstrap method (see Methods). c ToE diagnosed from a 60–80-year sliding window for E-index variability in all 31 CMIP5 and 37 CMIP6 models. Only models that show ToE spanning the whole 60–80-year window are indicated by red bars, otherwise they are greyed out. Multi-model mean and median values are indicated by the horizontal solid and dashed lines, respectively. Numbers on the upper left denote the number of models showing ToE in the CMIP5 (black) or CMIP6 (purple) multi-model ensemble. d As in c, but for C-index. Results shown here are based on the RCP85/SSP585 scenario for a future warming climate.
Geng, T., Cai, W., Wu, L. et al. Emergence of changing Central-Pacific and Eastern-Pacific El Niño-Southern Oscillation in a warming climate. Nat Commun 13, 6616 (2022). https://doi.org/10.1038/s41467-022-33930-5