Vertical fluxes of nutrients enhanced by strong turbulence and phytoplankton bloom around the ocean ridge in the Luzon Strait
Eisuke Tsutsumi, Takeshi Matsuno, Sachihiko Itoh, Jing Zhang, Tomoharu Senjyu, Akie Sakai, Keunjong Lee, Daigo Yanagimoto, Ichiro Yasuda, Hiroshi Ogawa & Cesar Villanoy
Published in Scientific Reports, OCT 2020
Steep oceanic ridges and tidal currents in the Luzon Strait generate some of the world’s strongest turbulent mixing. To evaluate the impacts of the turbulence intensity on the marine ecosystem, we carried out measurements of microstructure turbulence and biogeochemical hydrography along 21°N in the Luzon Strait during the R/V Hakuho Maru cruise, KH-17-5-2, in November 2017. We found a turbulent kinetic energy dissipation rate exceeding O(10−7) W kg−1 and vertical eddy diffusivity exceeding O(10−3) m2 s−1, two orders of magnitude larger than those in the open ocean, above a shallow sub-ridge on the eastern ridge of the Luzon Strait. In addition, a clear chlorophyll a bloom was identified in the surface layer above the sub-ridge from in situ measurements and satellite observations. High values of nitrate (4.7 mmol N m−2 d−1) and phosphate (0.33 mmol P m−2 d−1) fluxes estimated near the base of the surface chlorophyll a bloom strongly suggest that enhanced turbulent mixing promotes nutrient supply to the euphotic zone and generates new production within the surface layer, contributing to the formation of a quasi-permanent local chlorophyll a bloom north of Itbayat Island on the eastern ridge.
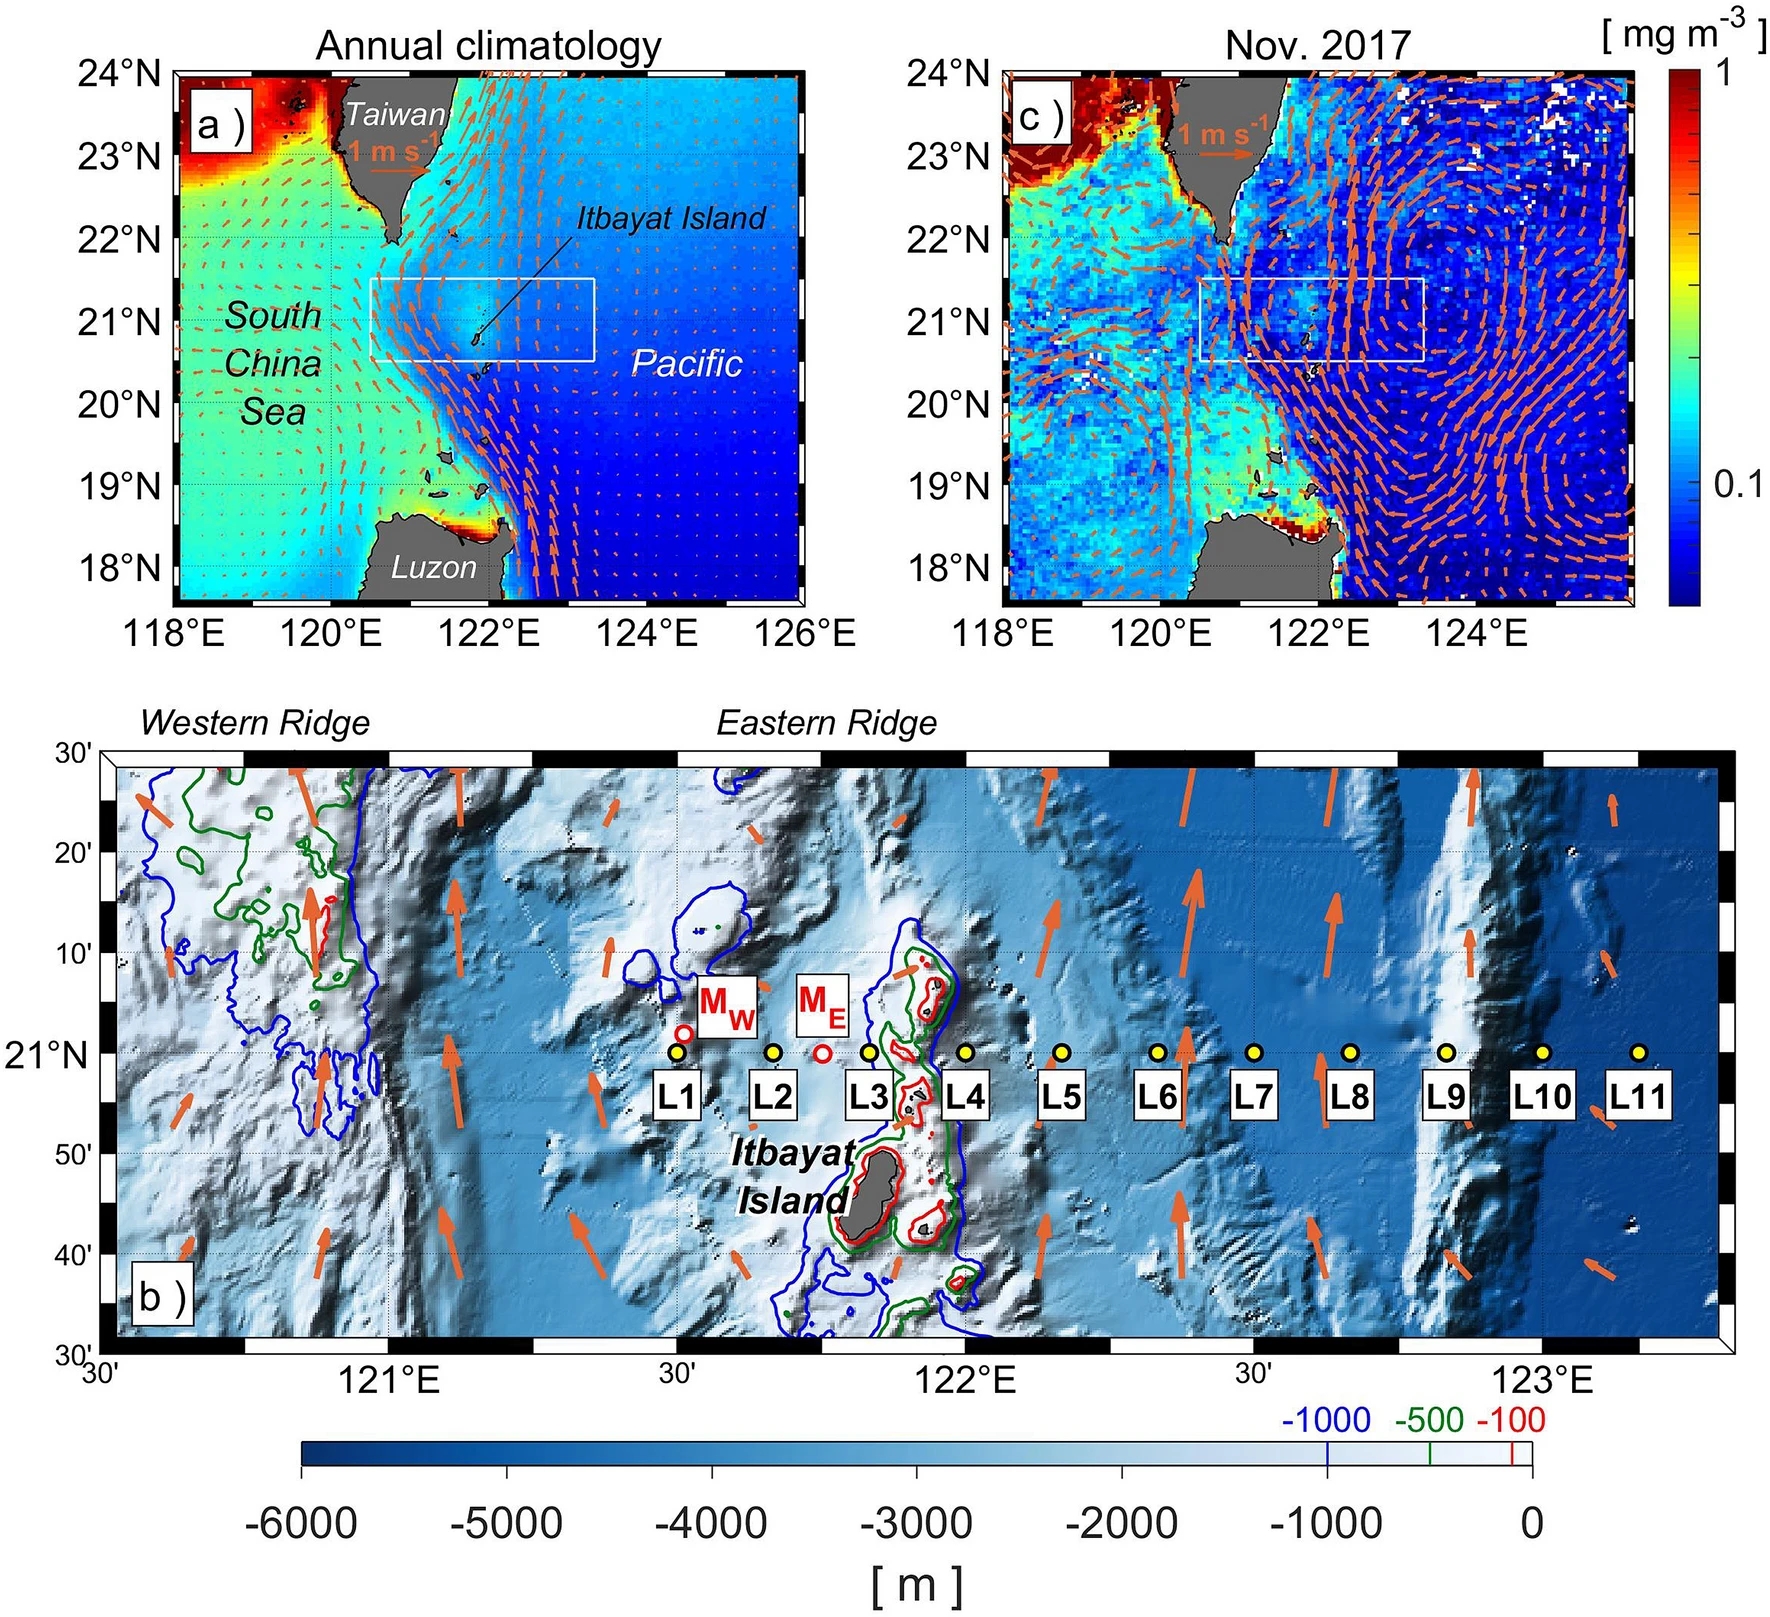
Fig. Map of surface chlorophyll a concentration, geostrophic currents, and bathymetry around the Luzon Strait. (a) Annual climatology of MODIS-Aqua chlorophyll a (color shading) and CMEMS absolute geostrophic velocity (arrows) during 2004–2018. The location of the experiment site is indicated by the white rectangle. (b) Bathymetric map with microstructure stations L1–L11. Red circles represent mooring stations; MW and ME are where upward-looking 75-kHz Long Ranger ADCPs were moored. Red, green, and blue lines in the bathymetric map show the 100, 500, and 1000-m isobaths, respectively. Arrows represent absolute geostrophic velocity during the experiment period. (c) Weekly averaged surface chlorophyll a and absolute geostrophic velocity, as in (a) but for November 2017. Color scale for chlorophyll a is the same in (a) and (c).
Tsutsumi, E., Matsuno, T., Itoh, S. et al. Vertical fluxes of nutrients enhanced by strong turbulence and phytoplankton bloom around the ocean ridge in the Luzon Strait. Sci Rep 10, 17879 (2020). https://doi.org/10.1038/s41598-020-74938-5