Hydraulics and Mixing of the Deep Overflow in the Lifamatola Passage of the Indonesian Seas
Shuwen Tan, Larry J. Pratt, Dongliang Yuan, Xiang Li, Zheng Wang, Yao Li, Corry Corvianawatie, Dewi Surinati,
Asep S. Budiman, and Ahmad Bayhaqi
Published in JOURNAL OF PHYSICAL OCEANOGRAPHY, September 2020
Hydrographic measurements recently acquired along the thalweg of the Lifamatola Passage combined with historical moored velocity measurements immediately downstream of the sill are used to study the hydraulics, transport, mixing, and entrainment in the dense overflow. The observations suggest that the mean overflow is nearly critical at the mooring site, suggesting that a weir formula may be appropriate for estimating the overflow transport. Our assessment suggests that the weir formulas corresponding to a rectangular, triangular, or parabolic cross section all result in transports very close to the observation, suggesting their potential usage in long-term monitoring of the overflow transport or parameterizing the transport in numerical models. Analyses also suggest that deep signals within the overflow layer are blocked by the shear flow from propagating upstream, whereas the shallow wave modes of the full-depth continuously stratified flow are able to propagate upstream from the Banda Sea into the Maluku Sea. Strong mixing is found immediately downstream of the sill crest, with Thorpe-scale-based estimates of the mean dissipation rate within the overflow up to 1.1 × 10⁻⁷ W kg−1 and the region-averaged diapycnal diffusivity within the downstream overflow in the range of 2.3 × 10⁻³ to 10.1 × 10⁻³ m2 s−1. Mixing in the Lifamatola Passage results in 0.6–1.2-Sv (1 Sv ≡ 106 m3 s−1) entrainment transport added to the overflow, enhancing the deep-water renewal in the Banda Sea. A bulk diffusivity coefficient estimated in the deep Banda Sea yields 1.6 × 10⁻³ ± 5 × 10⁻⁴ m2 s−1, with an associated downward turbulent heat flux of 9 W m−2.
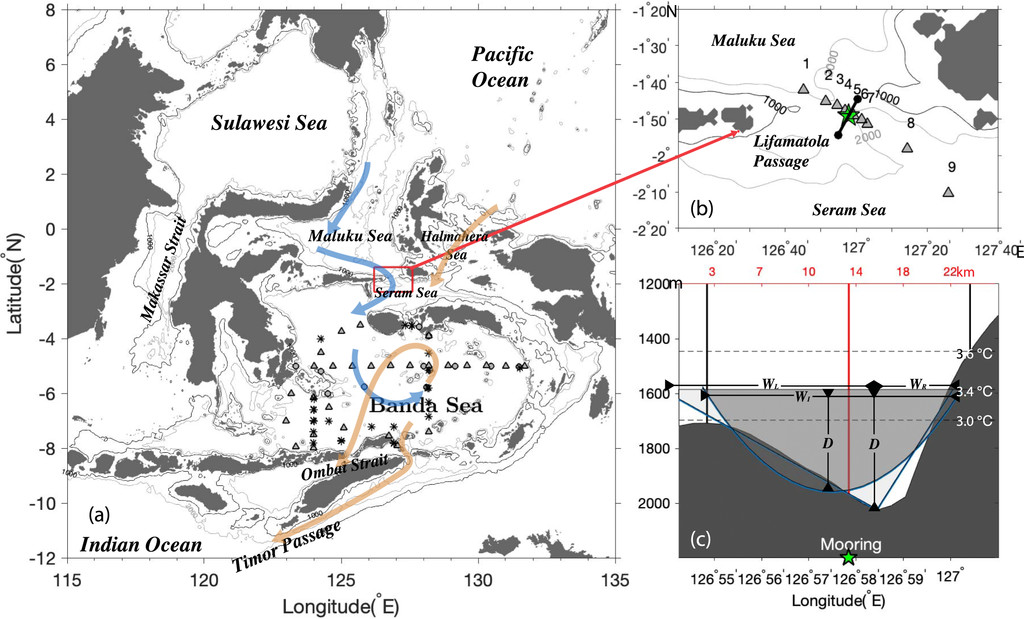
(a) Map of the Indonesian Seas and schematic of the eastern route of the Indonesian Throughflow (ITF). The blue and yellow arrows show pathways of the deeper and shallower part of the ITF, respectively. Circles, triangles, and asterisks in the Banda Sea mark WOCE CTD stations that reach shallower than 2000 m, 2000–3000 m, and deeper than 3000 m, respectively. Black and gray contours [also in (b)] show the 1000- and 2000-m isobaths, respectively. (b) The boxed inset shows the map of the study region, CTD stations occupied from 29 to 30 Sep 2017 (numbered triangles), and the INSTANT mooring location (green star). The black line with dots on the ends represents the cross section used to estimate transport below Θ = 3.6°C (c) The topography cross section at the mooring location (red line), with two black lines representing the location of the two ends [black dots in (b)] of the 21-km-wide section. The blue lines and curve are the best-fit triangle (light gray area) and parabola (dark gray area) to the topography below the Θ = 3.4°C isotherm. The levels of Θ = 3.0°, 3.4°, and 3.6°C are shown in dashed lines.
Citation: Journal of Physical Oceanography 50, 9; 10.1175/JPO-D-19-0326.1
Tan, S., Pratt, L., Yuan D.*, and Coauthors, 2020: Hydraulics and Mixing of the Deep Overflow in the Lifamatola Passage of the Indonesian Seas. Journal of Physical Oceanography, 2020, 50: 2797–2814, https://doi.org/10.1175/JPO-D-19-0326.1.