Published in JOURNAL OF PHYSICAL OCEANOGRAPHY, JUNE 2020
Historical observations have documented prominent changes of the Mindanao Current (MC) during El Niño events, yet a systematic understanding of how the El Niño modulates the MC is still lacking. Mooring observations during December 2010-August 2014 revealed evident year-to-year variations of the MC in the upper 400 m that were well reproduced by HYbrid Coordinate Ocean Model (HYCOM). The composite analysis is conducted for ten El Niño events during 1980-2015 using five model-based datasets (HYCOM, OFES, GEOS-ODA, SODA2.2.4 and SODA3.3.1). A qualitative consensus is reached in suggesting that a developing (decaying) El Niño strengthens (weakens) the MC, albeit with the differences among events and datasets. HYCOM experiments demonstrate that the MC variability is mainly 1st baroclinic mode response to surface wind forcing of the tropical Pacific, but the specific mechanism varies with latitude. The upstream part of the MC north of 7.5°N is controlled by wind forcing between 6°-9°N through Ekman pumping, whereas its downstream part south of 7.5°N is greatly affected by equatorial winds. Prevailing westerly winds and Ekman upwelling in the developing stage cause cyclonic anomalous circulation in the northwest tropical Pacific that strengthens the MC, and the opposite surface wind forcing effect in the decaying stage weakens the MC. Although models show difficulties in realistically representing the northward-flowing Mindanao Undercurrent (MUC) beneath the MC and its seasonal and interannual variations, all the five products suggest an enhancement of the MUC during the decaying stage of El Niño.
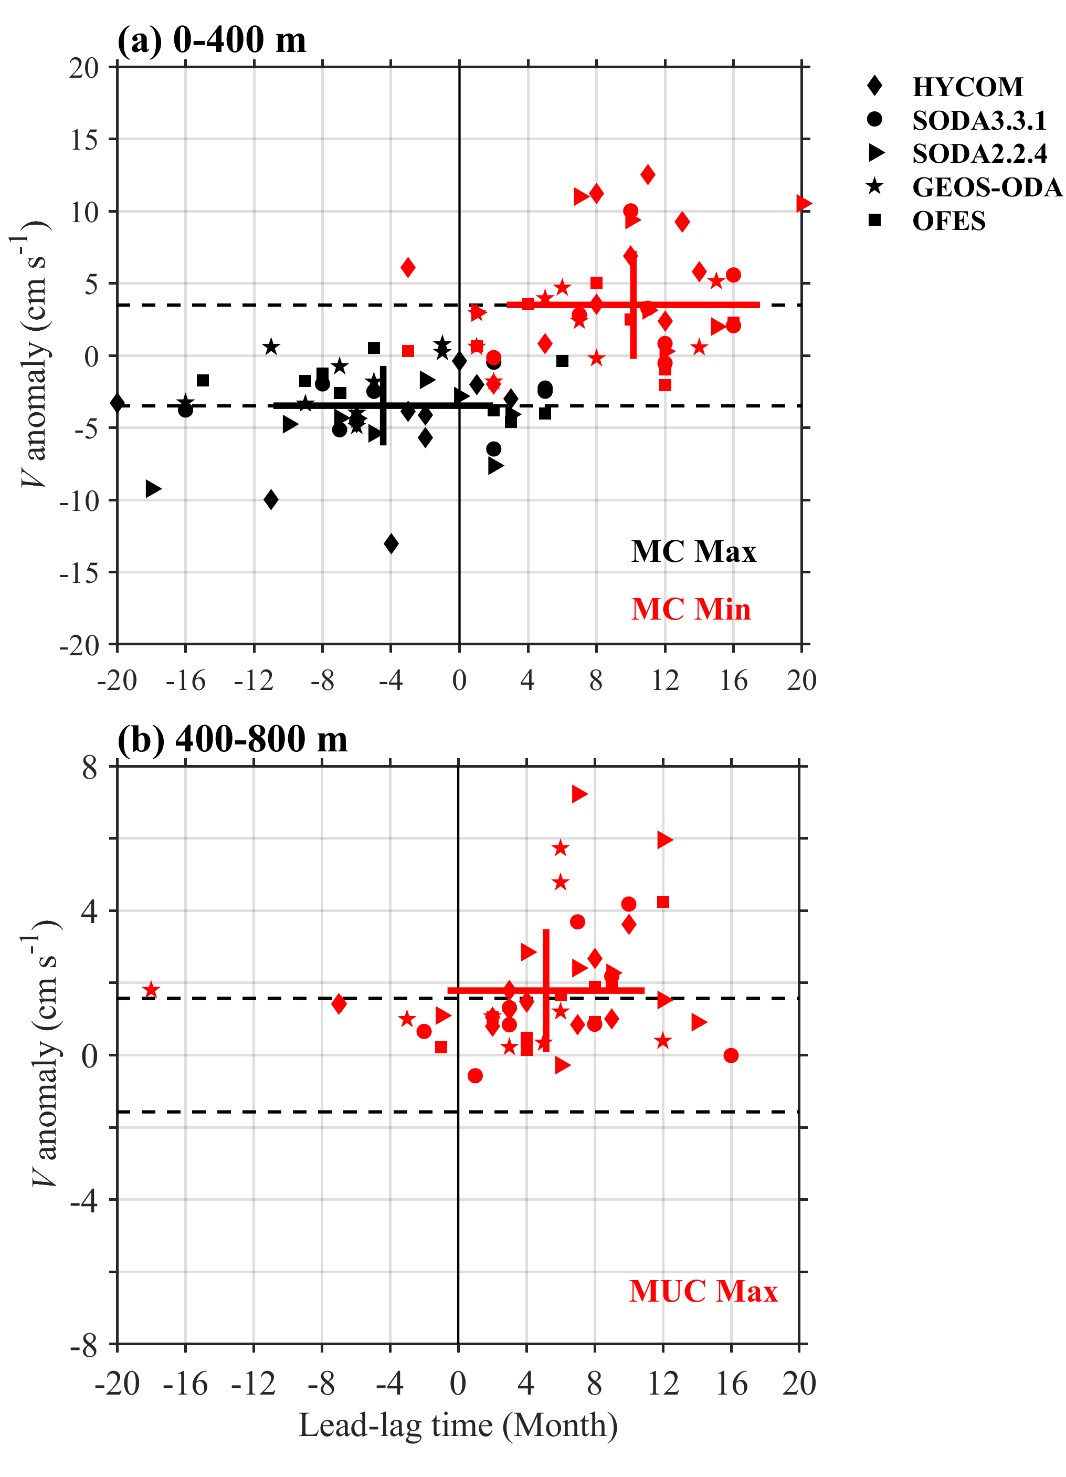
FIG. (a) The maxima (red) and minima (black) of 0-400 m V anomaly (cm s-1) averaged over 7°-9°N, 126.5°-129.5°E with respect to the lead-lag time of El Niño events. T = 0 denotes the peak month of an El Niño event. Results of HYCOM, SODA3.3.1, SODA2.2.4, GEOS-ODA and OFES are plotted with different symbols. The ‘+’ indicates the one standard deviation range. The thin dashed line denotes the standard deviation of V anomaly. (b) is the same as (a) but for the maxima of 400-800 m V anomaly.
Ren, Q., Y. Li, F. Wang, J. Duan, S. Hu, and F. Wang (2020), Variability of the Mindanao Current Induced by El Niño Events, Journal of Physical Oceanography, 50(6), 1753–1772, https://doi.org/10.1175/JPO-D-19-0150.1.