Published in Scientific Reports, 31 December 2019
Near-inertial waves (NIWs) contain a pronounced portion of shear energy in the internal wave field and is of great importance to deep ocean mixing. However, accurate simulation of NIWs remains a challenge. Here we analyzed 3-year long mooring observation of velocity profiles over 80-800 m to study the responses of near-inertial downward shear to varying wind stress curls and sea level anomalies (SLAs). It is demonstrated that moderate (even weak) cyclone makes more contributions to enhanced shear below the pycnocline than very strong cyclone. Because very strong curl can stall the downward propagation of large shear. The large positive and negative SLAs cause the accumulation of large shear in the lower and upper parts of the pycnocline through inducing downwelling and upwelling motions, respectively. Time variation of near-inertial shear was strongly influenced by cases of large curls and interannual variation of SLA, and thus did not follow the seasonal variation of wind stress. Our analyses suggest that matched fields of wind stress curl and SLA, and well representing the ocean response to moderate cyclone are needed in simulating the role of NIWs on mixing.

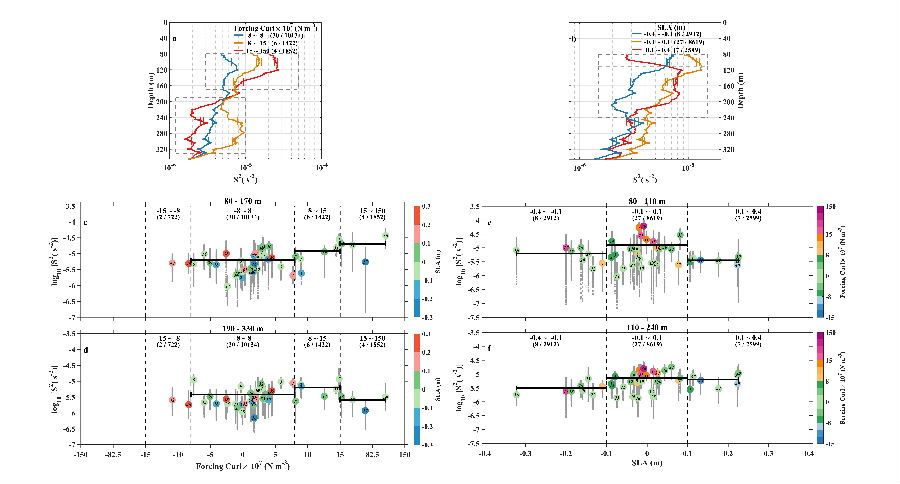
Fig. Ensemble and scatter plots of mean near-inertial downward shear energy (S2) with different wind stress curls and SLAs. Vertical distributions of hourly S2 averaged over ensembles of (a) weak, moderate, and strong wind stress curls and (b) negative, reference, and positive SLAs. For each ensemble, 95% confidence intervals derived from the bootstrap method are indicated by horizontal bars. Scatter diagrams of forcing curls versus case mean (color large dots) and hourly-profile mean (small gray dots) S2 over (c) 80-170 m and (d) 190-330 m (denoted by dashed box in panel a), with color depicting SLA. Scatter diagrams of SLA with case mean (color large dots) and hourly-profile mean (small gray dots) S2 over (c) 80-110 m and (d) 110-240 m (denoted by dashed box in panel b), with color depicting forcing curl. The ensemble ranges, the corresponding numbers of cases (number before slash in bracket) and hourly profiles (number after slash in bracket) are denoted in each panel. In c-f, the number centered in large dots denotes the case serial number, vertical dashed lines server as a guide to separate different ensembles, and three bold horizontal lines indicate the average value of case mean S2 over different ensembles. (Gao et al., 2019, Sci Rep)
Gao, J., Wang, J. & Wang, F. Response of Near-Inertial Shear to Wind Stress Curl and Sea Level. Sci Rep 9, 20417 (2019). https://doi.org/10.1038/s41598-019-56822-z