Long-term mean mass, heat and nutrient flux through the Indonesian Seas, based on the tritium inventory in the Pacific and Indian oceans
Published in Journal of Geophysical Research: Oceans, 17 June 2019
The water transfer between the Pacific and Indian Oceans, commonly referred to as the Indonesian Throughflow (ITF), is the only tropical inter-basin oceanic pathway, which plays a critical role in the redistribution of heat and mass, affecting both the regional and global climate systems. Due to the strong variability at both seasonal and interannual-interdecadal time scales and the multi-pathway of the Indonesian throughflow (ITF), constraining the long-term mean ITF volume transport is challenging. Chemical tracer method is a good complement for physical observations to constrain the temporally integrated result. Based on the distributions and changes in the tritium inventory, and tritium budgets in and between the South Pacific and Southern Indian oceans from the GEOSECS and WOCE programs, the long-term mean water mass transport of the ITF is estimated. The flux associated with the North Pacific component, between 70 and 90% of the ITF, is calculated to be 14.1 ± 2.7 Sv. The layer from 0 to 250 m, including most of the thermocline, with its strong depth-averaged velocity, accounts for 7.3 ± 0.6 Sv. The flux between 250 and 650 m is 5.4 ± 1.3 Sv, and between 650 and 1000 m it is about 1.4 ± 3.0 Sv. Including the water mass from the South Pacific Ocean, the total transport estimate is 16.2 ± 3.5 Sv, which represents a long-term mean value of the ITF covering several El Niño and La Niña periods. The heat transport associated with the North Pacific component of the ITF is 0.84 ± 0.14 PW. Heat loss before the ITF waters exit the Indian Ocean from 30°S is minimal. The net community productivities associated with the ITF is estimates as 215 ± 206 mg-C∙m-2∙d-1 (nitrogen budget model) and 267 ± 228 mg-C∙m-2∙d-1 (phosphate budget model) in the Indonesian seas. Strong vertical diffusion dominates nutrient supply to the photic zone supporting the high new productivity.

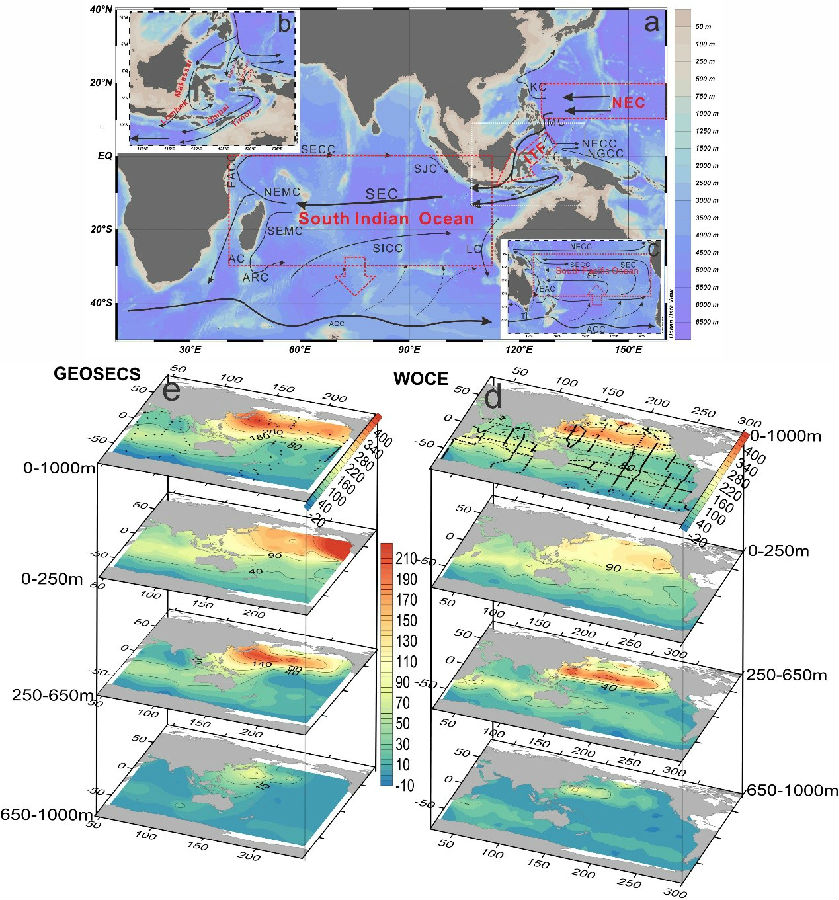
Figure Distributions of the tritium inventory (TU∙m, TU = 3H/1H×1018) at different depths in Pacific and Indian Ocean. (a): Schematic illustration of the major current systems in the study area modified from (Hu et al., 2015; Peng et al., 2015; Schott and McCreary, 2001; Sprintall et al., 2014). The red dotted line frames in (a) show the box regions of South Indian Ocean, South Pacific Ocean and partial NEC. The red dotted arrows show the net flows. Panel (b) is a more detailed schematic of the pathway of ITF in Indonesian seas. Panel (c) is the major current in South Pacific Ocean. (d) and (e) exhibit the tritium inventories for WOCE and GEOSECS data. Station locations are shown as black dots in the top map layers (0-1000m). The tritium inventory in 0-1000 m, 0-250 m, 250-650 m and 650-1000 m were calculated by vertically integrating the concentration from the surface to 1000 m, from the surface to 250 m, from 250 to 650 m and from 650 to 1000 m, respectively.
Xie, Tengxiang, Newton, Robert, Schlosser, Peter, Du, Chuanjun, & Dai, Minhan (2019). Long‐term mean mass, heat and nutrient flux through the Indonesian Seas, based on the tritium inventory in the Pacific and Indian Oceans. Journal of Geophysical Research: Oceans, 124, 3859–3875. https://doi.org/10.1029/2018JC014863