Decadal SST Variability in the Southeast Indian Ocean and Its Impact on Regional Climate
Published in Journal of Climate, 20 June 2019
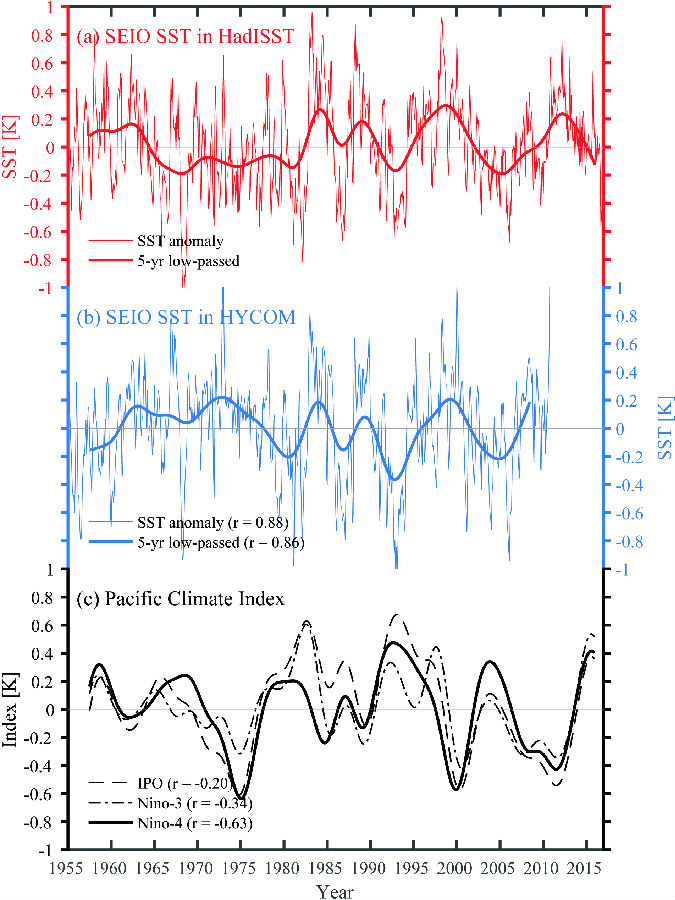
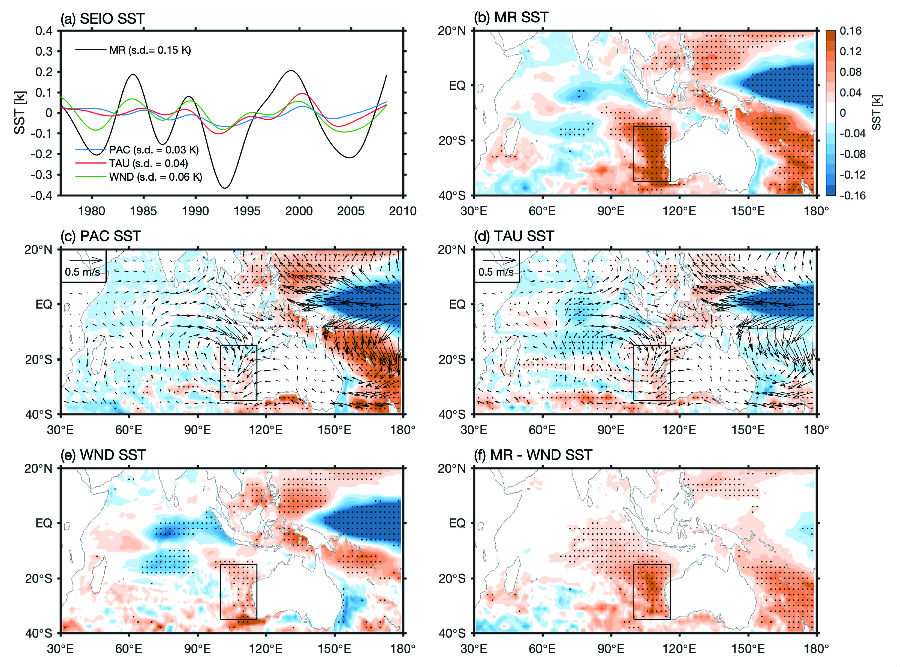
The southeast Indian Ocean (SEIO) exhibits decadal variability in sea surface temperature (SST) with amplitudes of ∼0.2-0.3 K and covaries with the central Pacific (r = -0.63 with Niño-4 index for 1975-2010). In this study, the generation mechanisms of decadal SST variability are explored using an ocean general circulation model (OGCM), and its impact on atmosphere is evaluated using an atmospheric general circulation model (AGCM). OGCM experiments reveal that Pacific forcing through the Indonesian throughflow explains <20% of the total SST variability, and the contribution of local wind stress is also small. These wind-forced anomalies mainly occur near the Western Australian coast. The majority of SST variability is attributed to surface heat fluxes. The reduced upward turbulent heat flux (QT; latent plus sensible heat flux) owing to decreased wind speed and anomalous warm, moist air advection is essential for the growth of warm SST anomalies (SSTAs). The warming causes reduction of low cloud cover that increases surface shortwave radiation (SWR) and further promotes the warming. However, the resultant high SST along with the increased wind speed in the offshore area enhance the upward QT and begin to cool the ocean. Warm SSTAs co-occur with cyclonic low-level wind anomalies in the SEIO and enhanced rainfall over Indonesia and northwest Australia. AGCM experiments suggest that although the tropical Pacific SST has strong effects on the SEIO region through atmospheric teleconnection, the cyclonic winds and increased rainfall are mainly caused by the SEIO warming through local air-sea interactions.

Figure 1. Monthly SSTAs of the southeast Indian Ocean (SEIO; 358–158S, 1008–1168E) derived from (a) HadISST and (b) HYCOMMR; 5-yr low-passed anomalies are shown as thick lines. (c) 5-yr low-passed indexes of IPO, Niño-3, and Niño-4 computed with HadISST data. Correlation coefficients are computed for the period of July 1978–June 2008.

Figure 2. Decadal SSTAs simulated by HYCOM experiments. (a) 5-yr low-passed SST of the SEIO derived from MR, PAC, TAU, and WND.The correlation coefficients of PAC, TAU, andWNDwithMRare 0.56, 0.68, and 0.86, respectively. (b)–(f) Regression of SSTAs of (b) MR, (c) PAC, (d) TAU, (e) WND, and (f) MR 2 WND (the difference between MR and WND) regressed onto the 5-yr low-passed SEIO SST of MR. Stippling indicates .90% significance. In (c),(d), regression of ERA-20C surface winds onto the 5-yr low-passed SEIO SST of MR are shown as black vectors.
Li, Yuanlong & Han, Weiqing & Zhang, Lei & Wang, Fan. (2019). Decadal SST Variability in the Southeast Indian Ocean and Its Impact on Regional Climate. Journal of Climate. DOI: 10.1175/JCLI-D-19-0180.1.